Mouse Epigenetics and Nuclear Signaling ELISA Kits
Mouse HIF-1 alpha (Hypoxia Inducible Factor 1 Alpha) ELISA Kit (MOES01184)
- SKU:
- MOES01184
- Product Type:
- ELISA Kit
- Size:
- 96 Assays
- Uniprot:
- Q61221
- Sensitivity:
- 75pg/mL
- Range:
- 125-8000pg/mL
- ELISA Type:
- Sandwich
- Synonyms:
- HIF1A, HIF-1A, MOP1, PASD8, bHLHe78, basic helix-loop-helix transcription factor
- Reactivity:
- Mouse
- Sample Type:
- Serum, plasma and other biological fluids
- Research Area:
- Epigenetics and Nuclear Signaling
Description
| Assay type: | Sandwich |
| Format: | 96T |
| Assay time: | 4.5h |
| Reactivity: | Mouse |
| Detection Method: | Colormetric |
| Detection Range: | 125.00-8000 pg/mL |
| Sensitivity: | 75.00 pg/mL |
| Sample Volume Required Per Well: | 100µL |
| Sample Type: | Serum, plasma and other biological fluids |
| Specificity: | This kit recognizes Mouse HIF-1 alpha in samples. No significant cross-reactivity or interference between Mouse HIF-1 alpha and analogues was observed. |
This ELISA kit uses Sandwich-ELISA as the method. The micro ELISA plate provided in this kit has been pre-coated with an antibody specific to Mouse HIF-1 alpha. Standards or samples are added to the appropriate micro ELISA plate wells and combined with the specific antibody. Then a biotinylated detection antibody specific for Mouse HIF-1 alpha and Avidin-Horseradish Peroxidase (HRP) conjugate are added to each micro plate well successively and incubated. Free components are washed away. The substrate solution is added to each well. Only those wells that contain Mouse HIF-1 alpha, biotinylated detection antibody and Avidin-HRP conjugate will appear blue in color. The enzyme-substrate reaction is terminated by adding Stop Solution and the color turns yellow. The optical density (OD) is measured spectrophotometrically at a wavelength of 450 nm ± 2 nm. The OD value is proportional to the concentration of Mouse HIF-1 alpha. The concentration of Mouse HIF-1 alpha in samples can be calculated by comparing the OD of the samples to the standard curve.
| UniProt Protein Function: | HIF1A: a master transcriptional regulator of the adaptive response to hypoxia. Under hypoxic conditions, activates the transcription of over 40 genes, including erythropoietin, glucose transporters, glycolytic enzymes, vascular endothelial growth factor, HILPDA, and other genes whose protein products increase oxygen delivery or facilitate metabolic adaptation to hypoxia. Plays an essential role in embryonic vascularization, tumor angiogenesis and pathophysiology of ischemic disease. Binds to core DNA sequence 5'-[AG]CGTG-3' within the hypoxia response element (HRE) of target gene promoters. Activation requires recruitment of transcriptional coactivators such as CREBPB and EP300. Activity is enhanced by interaction with both, NCOA1 or NCOA2. Interaction with redox regulatory protein APEX seems to activate CTAD and potentiates activation by NCOA1 and CREBBP. Involved in the axonal distribution and transport of mitochondria in neurons during hypoxia. Interacts with the HIF1A beta/ARNT subunit; heterodimerization is required for DNA binding. Interacts with COPS5; the interaction increases the transcriptional activity of HIF1A through increased stability. Interacts with EP300 (via TAZ-type 1 domains); the interaction is stimulated in response to hypoxia and inhibited by CITED2. Interacts with CREBBP (via TAZ-type 1 domains). Interacts with NCOA1, NCOA2, APEX and HSP90. Interacts (hydroxylated within the ODD domain) with VHLL (via beta domain); the interaction, leads to polyubiquitination and subsequent HIF1A proteasomal degradation. During hypoxia, sumoylated HIF1A also binds VHL; the interaction promotes the ubiquitination of HIF1A. Interacts with SENP1; the interaction desumoylates HIF1A resulting in stabilization and activation of transcription. Interacts (Via the ODD domain) with ARD1A; the interaction appears not to acetylate HIF1A nor have any affect on protein stability, during hypoxia. Interacts with RWDD3; the interaction enhances HIF1A sumoylation. Interacts with TSGA10. Interacts with RORA (via the DNA binding domain); the interaction enhances HIF1A transcription under hypoxia through increasing protein stability. Interaction with PSMA7 inhibits the transactivation activity of HIF1A under both normoxic and hypoxia- mimicking conditions. Interacts with USP20. Interacts with RACK1; promotes HIF1A ubiquitination and proteasome- mediated degradation. Interacts (via N-terminus) with USP19. Under reduced oxygen tension. Induced also by various receptor-mediated factors such as growth factors, cytokines, and circulatory factors such as PDGF, EGF, FGF2, IGF2, TGFB1, HGF, TNF, IL1B, angiotensin-2 and thrombin. However, this induction is less intense than that stimulated by hypoxia. Repressed by HIPK2 and LIMD1. Expressed in most tissues with highest levels in kidney and heart. Overexpressed in the majority of common human cancers and their metastases, due to the presence of intratumoral hypoxia and as a result of mutations in genes encoding oncoproteins and tumor suppressors. 2 isoforms of the human protein are produced by alternative splicing. |
| UniProt Protein Details: | Protein type:Autophagy; Transcription factor; DNA-binding Cellular Component: cytoplasm; cytosol; nuclear speck; nucleus; transcription factor complex Molecular Function:DNA binding; enzyme binding; histone acetyltransferase binding; histone deacetylase binding; Hsp90 protein binding; nuclear hormone receptor binding; protein binding; protein complex binding; protein dimerization activity; protein heterodimerization activity; protein kinase binding; RNA polymerase II transcription factor activity, enhancer binding; sequence-specific DNA binding; transcription factor activity; transcription factor binding; ubiquitin protein ligase binding Biological Process: angiogenesis; axon transport of mitochondrion; B-1 B cell homeostasis; blood vessel development; blood vessel morphogenesis; camera-type eye morphogenesis; cartilage development; cell differentiation; cellular iron ion homeostasis; cerebral cortex development; collagen metabolic process; connective tissue replacement during inflammatory response; digestive tract morphogenesis; elastin metabolic process; embryonic hemopoiesis; embryonic placenta development; epithelial to mesenchymal transition; glucose homeostasis; heart looping; hemoglobin biosynthetic process; lactate metabolic process; lactation; muscle maintenance; negative regulation of apoptosis; negative regulation of bone mineralization; negative regulation of growth; negative regulation of neuron apoptosis; negative regulation of ossification; negative regulation of TOR signaling pathway; negative regulation of transcription from RNA polymerase II promoter; negative regulation of vasoconstriction; neural crest cell migration; neural fold elevation formation; oxygen homeostasis; positive regulation of apoptosis; positive regulation of autophagy; positive regulation of cell proliferation; positive regulation of erythrocyte differentiation; positive regulation of gluconeogenesis; positive regulation of hormone biosynthetic process; positive regulation of macroautophagy; positive regulation of neuroblast proliferation; positive regulation of smooth muscle cell proliferation; positive regulation of transcription from RNA polymerase II promoter; positive regulation of transcription, DNA-dependent; positive regulation of vascular endothelial growth factor receptor signaling pathway; regulation of catalytic activity; regulation of cell proliferation; regulation of gene expression; regulation of glycolysis; regulation of transcription from RNA polymerase II promoter in response to oxidative stress; regulation of transcription, DNA-dependent; regulation of transforming growth factor-beta2 production; response to hypoxia; response to muscle activity; signal transduction; transcription, DNA-dependent; vasculature development; visual learning |
| NCBI Summary: | This gene encodes the alpha subunit which, along with the beta subunit, forms a heterodimeric transcription factor that regulates the cellular and developmental response to reduced oxygen tension. The transcription factor has been shown to regulate genes involved in several biological processes, including erythropoiesis and angiogenesis which aid in increased delivery of oxygen to hypoxic regions. The transcription factor also plays a role in the induction of genes involved in cell proliferation and survival, energy metabolism, apoptosis, and glucose and iron metabolism. Alternative splicing results in multiple transcript variants encoding different isoforms. [provided by RefSeq, Sep 2015] |
| UniProt Code: | Q61221 |
| NCBI GenInfo Identifier: | 32470615 |
| NCBI Gene ID: | 15251 |
| NCBI Accession: | Q61221. 3 |
| UniProt Secondary Accession: | Q61221,O08741, O08993, Q61664, Q61665, Q8C681, Q8CC19 Q8CCB6, Q8R385, Q9CYA8, |
| UniProt Related Accession: | Q61221 |
| Molecular Weight: | 91,874 Da |
| NCBI Full Name: | Hypoxia-inducible factor 1-alpha |
| NCBI Synonym Full Names: | hypoxia inducible factor 1, alpha subunit |
| NCBI Official Symbol: | Hif1a |
| NCBI Official Synonym Symbols: | MOP1; bHLHe78; AA959795; HIF1alpha; HIF1-alpha; HIF-1-alpha |
| NCBI Protein Information: | hypoxia-inducible factor 1-alpha |
| UniProt Protein Name: | Hypoxia-inducible factor 1-alpha |
| UniProt Synonym Protein Names: | ARNT-interacting protein |
| Protein Family: | Hypoxia-inducible factor |
| UniProt Gene Name: | Hif1a |
| UniProt Entry Name: | HIF1A_MOUSE |
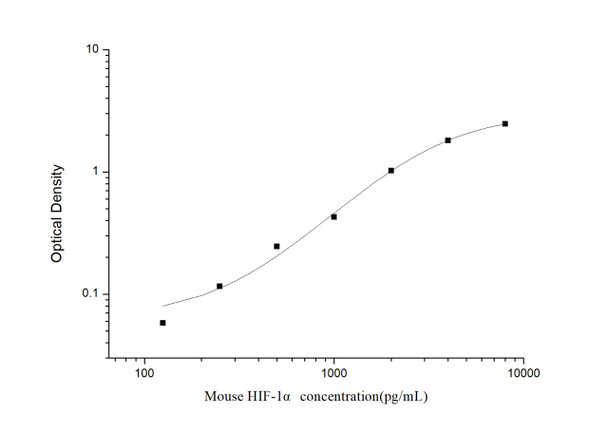
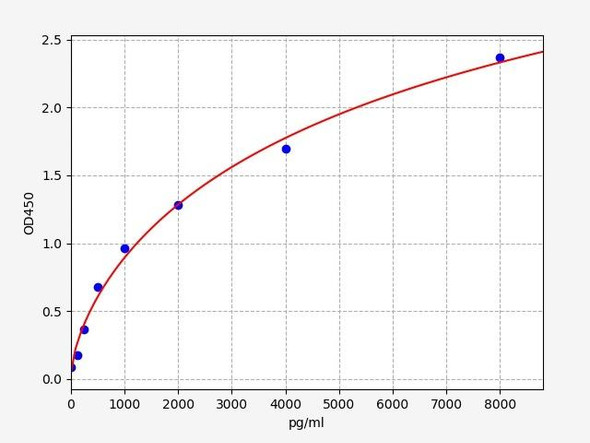
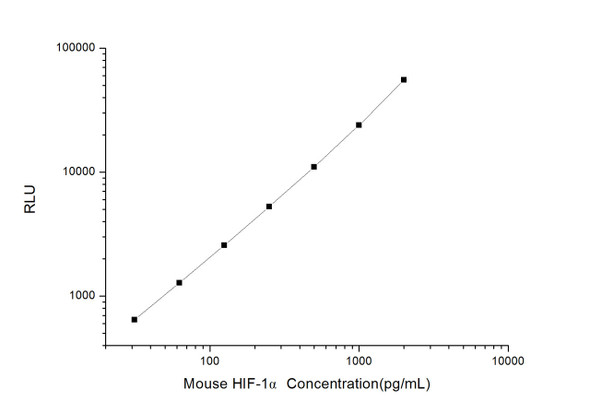
As the OD values of the standard curve may vary according to the conditions of the actual assay performance (e. g. operator, pipetting technique, washing technique or temperature effects), the operator should establish a standard curve for each test. Typical standard curve and data is provided below for reference only.
| Concentration (pg/mL) | O.D | Average | Corrected |
| 8000 | 2.526 2.562 | 2.544 | 2.465 |
| 4000 | 1.866 1.912 | 1.889 | 1.81 |
| 2000 | 1.112 1.094 | 1.103 | 1.024 |
| 1000 | 0.497 0.513 | 0.505 | 0.426 |
| 500 | 0.332 0.318 | 0.325 | 0.246 |
| 250 | 0.209 0.181 | 0.195 | 0.116 |
| 125.00 | 0.132 0.142 | 0.137 | 0.058 |
| 0 | 0.074 0.084 | 0.079 | -- |
Precision
Intra-assay Precision (Precision within an assay): 3 samples with low, mid range and high level Mouse HIF-1 alpha were tested 20 times on one plate, respectively.
Inter-assay Precision (Precision between assays): 3 samples with low, mid range and high level Mouse HIF-1 alpha were tested on 3 different plates, 20 replicates in each plate.
| Intra-assay Precision | Inter-assay Precision | |||||
| Sample | 1 | 2 | 3 | 1 | 2 | 3 |
| n | 20 | 20 | 20 | 20 | 20 | 20 |
| Mean (pg/mL) | 387.70 | 1086.20 | 2742.50 | 371.80 | 1120.30 | 2531.80 |
| Standard deviation | 24.80 | 46.70 | 109.70 | 19.70 | 58.30 | 108.90 |
| C V (%) | 6.40 | 4.30 | 4.00 | 5.30 | 5.20 | 4.30 |
Recovery
The recovery of Mouse HIF-1 alpha spiked at three different levels in samples throughout the range of the assay was evaluated in various matrices.
| Sample Type | Range (%) | Average Recovery (%) |
| Serum (n=5) | 86-100 | 93 |
| EDTA plasma (n=5) | 93-105 | 99 |
| Cell culture media (n=5) | 89-102 | 95 |
Linearity
Samples were spiked with high concentrations of Mouse HIF-1 alpha and diluted with Reference Standard & Sample Diluent to produce samples with values within the range of the assay.
| Serum (n=5) | EDTA plasma (n=5) | Cell culture media (n=5) | ||
| 1:2 | Range (%) | 90-104 | 86-100 | 85-95 |
| Average (%) | 96 | 92 | 90 | |
| 1:4 | Range (%) | 96-109 | 84-95 | 91-108 |
| Average (%) | 101 | 89 | 98 | |
| 1:8 | Range (%) | 97-110 | 86-100 | 95-109 |
| Average (%) | 104 | 92 | 103 | |
| 1:16 | Range (%) | 93-107 | 82-94 | 95-108 |
| Average (%) | 101 | 89 | 100 |
An unopened kit can be stored at 4°C for 1 month. If the kit is not used within 1 month, store the items separately according to the following conditions once the kit is received.
| Item | Specifications | Storage |
| Micro ELISA Plate(Dismountable) | 8 wells ×12 strips | -20°C, 6 months |
| Reference Standard | 2 vials | |
| Concentrated Biotinylated Detection Ab (100×) | 1 vial, 120 µL | |
| Concentrated HRP Conjugate (100×) | 1 vial, 120 µL | -20°C(shading light), 6 months |
| Reference Standard & Sample Diluent | 1 vial, 20 mL | 4°C, 6 months |
| Biotinylated Detection Ab Diluent | 1 vial, 14 mL | |
| HRP Conjugate Diluent | 1 vial, 14 mL | |
| Concentrated Wash Buffer (25×) | 1 vial, 30 mL | |
| Substrate Reagent | 1 vial, 10 mL | 4°C(shading light) |
| Stop Solution | 1 vial, 10 mL | 4°C |
| Plate Sealer | 5 pieces | |
| Product Description | 1 copy | |
| Certificate of Analysis | 1 copy |
- Set standard, test sample and control (zero) wells on the pre-coated plate and record theirpositions. It is recommended to measure each standard and sample in duplicate. Note: addall solutions to the bottom of the plate wells while avoiding contact with the well walls. Ensuresolutions do not foam when adding to the wells.
- Aliquot 100µl of standard solutions into the standard wells.
- Add 100µl of Sample / Standard dilution buffer into the control (zero) well.
- Add 100µl of properly diluted sample (serum, plasma, tissue homogenates and otherbiological fluids) into test sample wells.
- Cover the plate with the sealer provided in the kit and incubate for 90 min at 37°C.
- Aspirate the liquid from each well, do not wash. Immediately add 100µL of BiotinylatedDetection Ab working solution to each well. Cover the plate with a plate seal and gently mix. Incubate for 1 hour at 37°C.
- Aspirate or decant the solution from the plate and add 350µL of wash buffer to each welland incubate for 1-2 minutes at room temperature. Aspirate the solution from each well andclap the plate on absorbent filter paper to dry. Repeat this process 3 times. Note: a microplatewasher can be used in this step and other wash steps.
- Add 100µL of HRP Conjugate working solution to each well. Cover with a plate seal andincubate for 30 min at 37°C.
- Aspirate or decant the solution from each well. Repeat the wash process for five times asconducted in step 7.
- Add 90µL of Substrate Reagent to each well. Cover with a new plate seal and incubate forapproximately 15 min at 37°C. Protect the plate from light. Note: the reaction time can beshortened or extended according to the actual color change, but not by more than 30min.
- Add 50 µL of Stop Solution to each well. Note: Adding the stop solution should be done inthe same order as the substrate solution.
- Determine the optical density (OD value) of each well immediately with a microplate readerset at 450 nm.


